6 Questions with Charlotte Boulanger

Charlotte Boulanger, our Richard Hampton Jenrette Planning & Preservation Fellow, just wrapped up two remarkable years at MAS. In that time, she led the development of our organizational preservation agenda, helped steward our Enduring Culture Initiative, and carried much of our planning research across the finish line. She did all of this while earning a dual master’s in urban planning and historic preservation at Columbia University, from which she graduated in 2025.
Charlotte has since returned home to France. Before she left, she sat down with us to talk about the MAS Data Distillery, our data-driven content series that unpacks the built environment questions facing our city.
Read on to hear about Charlotte’s research and what she finds most fascinating about city data.
What is the Data Distillery?
The Data Distillery is a content series from MAS that makes publicly available planning and policy data more accessible. There is an enormous amount of city data available, but it can sometimes be difficult to find and interpret. We try to “distill” that information into clear takeaways, data snapshots, and maps that help New Yorkers better understand what is happening in their city.
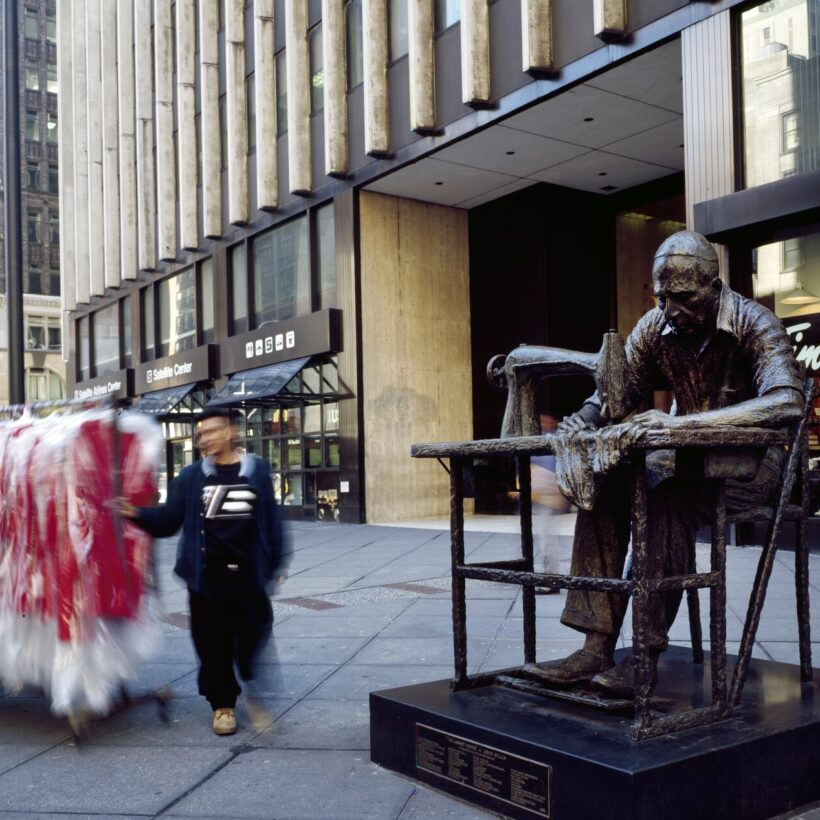
Our first installment explored the Midtown South Mixed-Use rezoning, focusing on how proposed development could impact the Garment District—its historic buildings, businesses, and workers. We identified 15 proposed development sites that were listed on the state and national registers and found that redevelopment could directly displace 114 garment-related businesses employing more than 450 workers.
Our most recent installment centered on where projected flood risk overlaps with the city’s historic building stock and what that could mean not only for the buildings themselves, but also for the city’s housing supply. We found that, for example, under a projected 2080 extreme rainfall scenario, nearly one in four designated historic sites could fall within projected flood zones.
Why do you think New Yorkers should know about the topics we’ve researched through the series?
Major citywide goals, like creating more housing and preparing for climate change, impact people’s lives—in ways big and small.
The Midtown South rezoning, for example, could create thousands of new homes. Our research added a fresh perspective by providing further analysis at the neighborhood scale. We were interested in evaluating how development might impact the existing economy and built environment of the area.
In the case of the latest Data Distillery focused on flooding, we found that 83 percent of the buildings projected to be at risk are residential. This datapoint made it so the story at hand wasn’t just about saving buildings but, rather, protecting people’s homes.
You begin with one question, but following the data often reveals a much bigger and more unexpected story.
Can you walk me through the life cycle of a Data Distillery installment, especially the one we just published? What made you want to explore the impact of flood risk on historic buildings and how did you go about sourcing the data?
Each Data Distillery starts with a hunch that comes out of MAS’s ongoing research and advocacy. We use data to test that hunch and explore how New York can become a more livable and resilient city. For the latest installment, we realized that while New York has extensive data on future flooding and data on historic buildings, those sources aren’t usually analyzed together.
Recent cloudbursts have made the effects of inland flooding increasingly visible, even though flood risk in New York is still often associated with coastal neighborhoods. We wanted to examine this growing threat in a way that connects MAS’s preservation legacy with our climate and housing work, showing what extreme rainfall could mean for older buildings and the New Yorkers who live in them.
One of the most striking moments emerged when we looked more closely at the city’s physical landscape. Several of the low-lying neighborhoods that scored highest in our risk analysis sit south of the terminal moraine, a ridge formed by ancient glaciers!
Suddenly, we were looking at a story that connected New York’s geology with its historic buildings and climate risk.
The hardest technical question we encountered was how to estimate the number of people affected by flood risk. Housing units are recorded by tax lot, but one lot can contain several buildings and only some of those buildings intersect the projected flood area.
We had to develop a methodology to estimate how units were distributed among those buildings based on their relative footprint and height. We then used average household size by borough to estimate the number of residents. This led to one of our most significant findings—that around 2 million New Yorkers currently live in buildings whose footprints intersect with the projected 2080 extreme rainfall flood layer.
That is what I find most exciting about Data Distillery. You begin with one question, but following the data often reveals a much bigger and more unexpected story.
Good research always leads to more research! If you could work on another Data Distillery on flood risk, what further questions would you want to explore about the intersections of flood risk and historic preservation?
If I could build upon our last Data Distillery on the impacts of flood risk, I’d be interested in looking into whether the buildings and communities we identified have the resources to prepare for it. I would map resilience investments, flood complaints, building violations, and indicators of financial vulnerability alongside our existing analysis. That could show us whether the neighborhoods facing the greatest risks are also receiving the infrastructure, funding, and technical support they need. I would particularly be interested in non-landmarked older buildings that make up a huge part of the city’s housing stock.
I would encourage New Yorkers to explore NYC Open Data or look up their building on ZoLa. If you find something surprising, or have a question the data might help answer, send it to us. It could inspire a future Data Distillery.
What should New Yorkers or anyone curious about city data know about the information our government agencies keep?
The city holds an extraordinary amount of information about our buildings, streets, neighborhoods, and infrastructure. Much of it is publicly available, so anyone can investigate a question affecting their community. But public data is rarely ready to use. Different agencies may describe the same place in different ways. One dataset might organize information by tax lot, while another looks at individual buildings.
The gaps can be just as important as the information provided. For example, the basement data we used only covers one- to three-family buildings and does not tell us whether a basement is occupied. That didn’t make the data useless. It meant we needed to be honest about what it could and couldn’t tell us—and also pair it with local knowledge.
I would encourage New Yorkers to explore NYC Open Data or look up their building on ZoLa. If you find something surprising, or have a question the data might help answer, send it to us. It could inspire a future Data Distillery.
What’s the most interesting dataset you’ve found in a city database?
I was fascinated to learn that the city maintains historical versions of its building footprints data. A building footprint, put simply, is the outline of a structure as seen from above. When you compare versions from different years, those outlines can reveal where buildings have appeared, disappeared, or changed shape. It turns a technical mapping layer into a record of the city’s physical evolution.
For a preservationist like me, that is especially interesting because it offers another way to understand change that might otherwise be hidden or difficult to measure.
Become a member and get inspired!
Related Initiatives
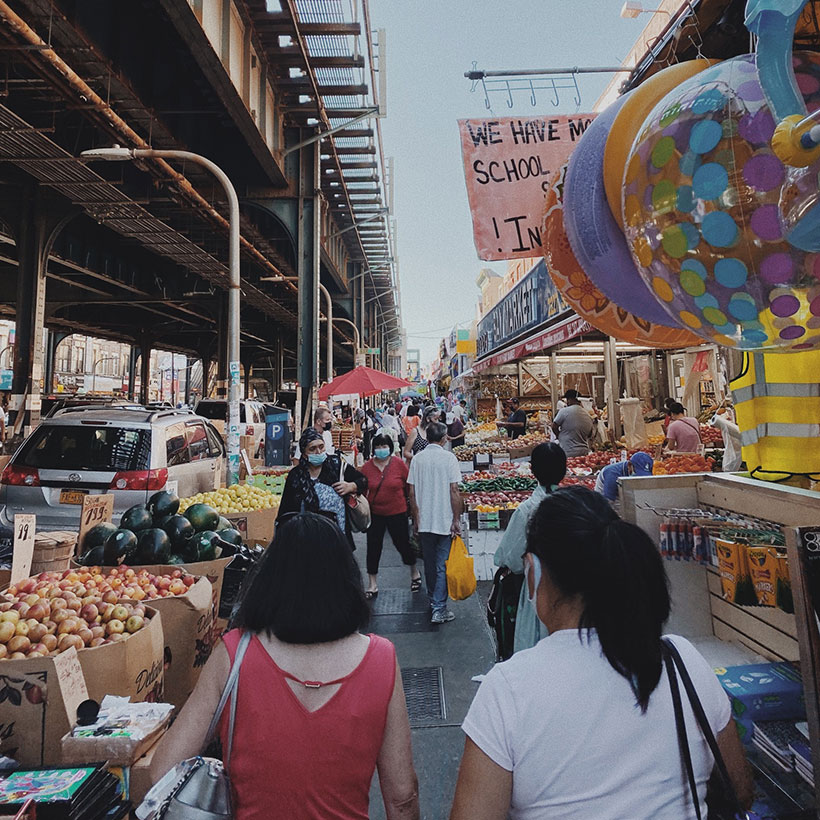
Supporting, celebrating, and preserving diverse cultural heritage throughout NYC
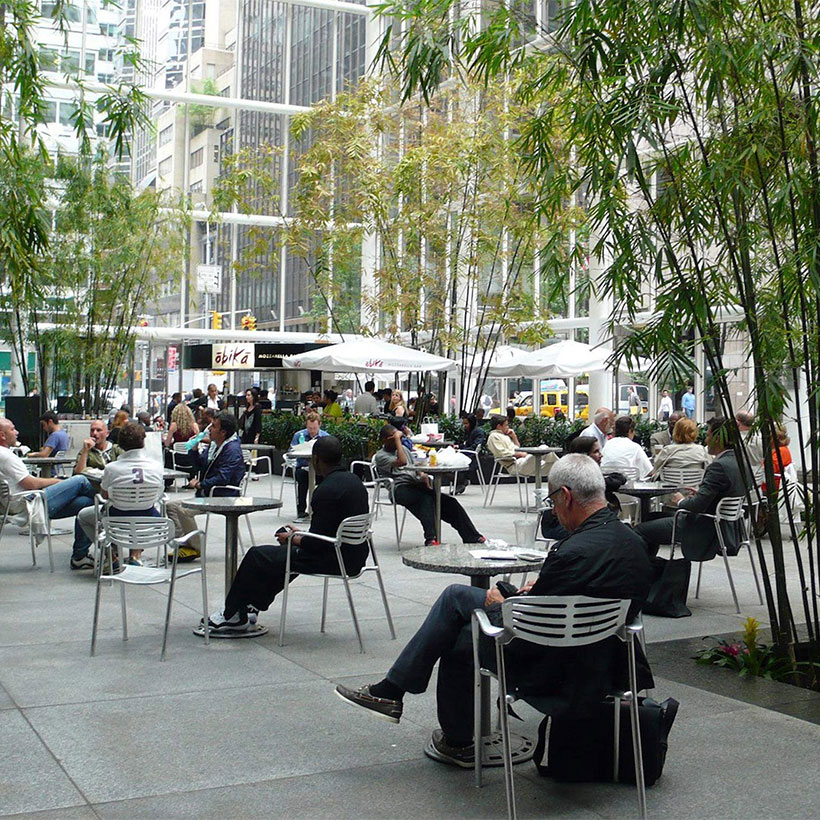
Protecting New York’s 80-acre network of public plazas and arcades