Data Distillery: Climate Risk, New York City’s Historic Buildings, and the New Yorkers Who Call Them Home
Project Authors: Rawnak Zaman, Charlotte Boulanger
Contributors: Noah Johnson
Welcome to the MAS Data Distillery, a multimedia content series demystifying timely issues pertaining to New York’s built environment. From current planning projects to citywide issues, each installment uses publicly available data to clarify a theme or dilemma unfolding within our city.
Follow us @mas_nyc on Instagram for more from Data Distillery.
As New York weathers another summer storm season, extreme rainfall is once again set to put the city’s infrastructure to the test. Just weeks ago, flash flooding in parts of Brooklyn and Queens overwhelmed streets, disrupted transportation, and stranded vehicles following intense rainfall. Forecasters are already warning that additional severe storms, localized flooding, and extreme heat may spell trouble for the region this summer. While increased flooding and climate risk impact the entire city, historic buildings are particularly vulnerable to repeated damage and eventual demolition caused by stormwater flooding.
Acknowledging this threat to existing buildings is critical as the Mamdani administration begins advancing its “Block by Block” housing plan, which pairs ambitious housing production targets with a commitment to preserve and stabilize 200,000 existing homes over the next decade. While new construction gets much of the attention, the contribution of new housing units is minimal compared to the more than 1 million buildings that make up New York City. Only 2,744 permits were filed for new structures in 2024.
The scale of this challenge becomes clearer when considering how extreme weather events are projected to impact our urban fabric over the coming decades. Understanding how climate risk may affect the city’s existing building stock is therefore not only a resilience challenge, but also a housing one.
By 2080:
21% of New York City’s current buildings, including 14% of historic pre-1960 buildings, will be at risk of flooding in an extreme rainfall scenario.
22.5% of designated historic sites will fall within projected flood zones, including individual landmarks and historic districts.
83% of at-risk buildings are residential, which further shows the importance of protecting the building stock for community stability.
An estimated 2 million New Yorkers will be impacted, as they currently call these buildings home.
Housing preservation and climate resilience must be addressed together.
An estimated 80% of New York City’s buildings were built before 1960, of which roughly 4% are landmarked.1 These structures merit protection not only for their role in the city’s historic fabric, but for their contribution to the city’s housing stock, small businesses, and community spaces. Their rehabilitation also comes with environmental benefits—avoiding the significant carbon emissions that come with demolishing and rebuilding.2 However, older buildings already experience a host of challenges related to maintenance and repair. Environmental impacts, like those from heavy rain and flooding, exacerbate these issues and are a growing threat.
Despite growing flood risk, preservation policy offers limited guidance for historic buildings that are not landmarked.
Non-landmarked buildings older than the city’s first FEMA Flood Insurance Rate Map, created in 1983, are exempt from many parts of the NYC Building Code—including elevation requirements—unless they undergo substantial improvements or alterations. The city has begun to address this issue with a recent Department of Buildings amendment and the forthcoming implementation of an Existing Building Code, which will provide a more comprehensive framework for work on existing buildings. However, the recent flood-related amendments remain limited, as many provisions only apply once buildings have sustained substantial damage.
Flooding affects basements, foundations, and mechanical systems in ways that compound over time. Because many older structures are exempt from flood-resilience regulations, improving resilience for historic buildings is challenging. Without standards tailored to older construction methods and materials, these buildings face cycles of damage and disinvestment that accelerate their decline.
Increased and persistent flood risk also raises repair costs and insurance premiums, making rehabilitation less feasible over time. For many residential properties, deferred maintenance and repeated flood damage can compound and intensify physical deterioration, threatening both housing quality and long-term affordability. Even landmarked buildings rarely benefit from flood resiliency guidelines that account for their unique construction and spatial constraints. Without such guidance, decisions are made on a case-by-case basis, which discourages long-term adaptation. While the consequences of flooding are well documented, the sources and patterns of flood risk are more varied than they are often perceived to be.
Flooding in New York City is often associated with coastal storms and waterfront neighborhoods, but extreme rainfall can create a different type of risk.
When heavy rain falls faster than streets, sewers, and drainage systems can absorb it, stormwater accumulates inland. To better understand how these risks may change over time, the Department of Environmental Protection (DEP) has developed projections showing where stormwater flooding is expected under future extreme rainfall scenarios. These projections distinguish between nuisance flooding, where water depths range from 4 to 12 inches, and deep-and-contiguous flooding, where water depths exceed 1 foot. Understanding how these projected risks are distributed across the city is critical to identifying where climate resilience challenges are likely to emerge.
Closing that gap begins with understanding where climate vulnerability and older building stock intersect.
The data needed to investigate the connection between climate resilience and historic buildings is publicly available, but it exists across multiple agencies and formats, making it difficult for communities and decision-makers to identify patterns or compare neighborhoods. By analyzing these datasets together, we identify patterns to inform broader advocacy conversations around climate resilience and preservation.
Through this analysis, 3 key findings emerged:
- Future stormwater flooding is projected to affect thousands of New York City’s older buildings, including many landmarked properties.
- Many neighborhoods facing the greatest overlap between flood risk and older building stock are located inland, not on the waterfront.
- Climate risk for historic buildings is not randomly distributed. It’s concentrated in distinct parts of the city, including Central Brooklyn and Southeast Queens.
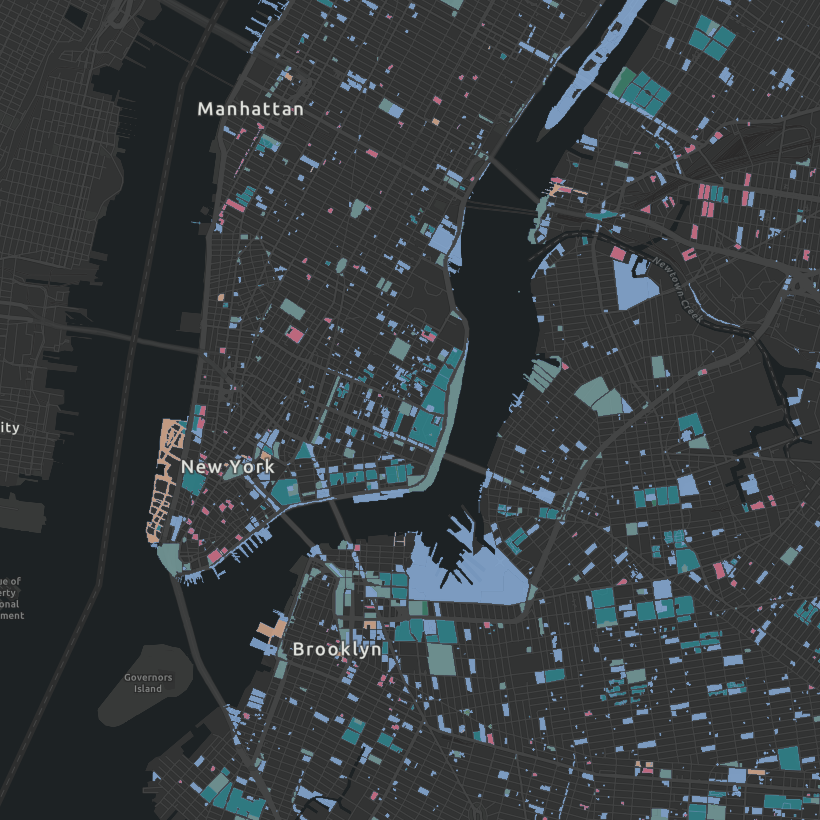
Projected stormwater flooding will reshape climate risk for New York City’s existing buildings by 2080.
Interactive Map
The landscape behind the map
The cluster of low-lying neighborhoods that scored highest in this analysis are south of the terminal moraine where ancient glaciers formed a range of higher elevation across Staten Island, Brooklyn, and Queens. This is a reminder of the interconnected, sometimes invisible systems that play a role in our city’s climate risk and required adaptation. In their latest Statements of Community District Needs, several community boards in Central Brooklyn, along the glacier line, identified street flooding among their chief challenges.
Why does this matter?
Making risk visible is a first step toward developing policies and infrastructure investments that help historic buildings, and the communities they belong to, remain viable in a changing climate. It also points toward several immediate opportunities for action:
- City agencies can use this information to prioritize flood mitigation investments in neighborhoods with high concentrations of historic buildings at risk. They can also develop flood-resilience guidance tailored to owners of older buildings, including non-landmarked properties.
- At the borough scale, these findings can help identify clusters of neighborhoods facing similar risks, allowing infrastructure investments to be coordinated across drainage systems and watershed boundaries rather than planned for one project at a time.
- At the neighborhood scale, a clearer understanding of local flood risk can help community boards and advocates make the case for infrastructure improvements that reflect on-the-ground conditions.
As the City advances the “Block by Block” housing plan, these findings reinforce MAS’s call to recognize existing buildings as a critical part of New York’s climate resilience strategy. Preserving housing is essential for maintaining affordability and protecting the physical buildings that make housing possible. As climate risks intensify, resilience investments will play an increasingly important role in maintaining both building quality and long-term neighborhood stability.
Methodology
How did we define “historic buildings”?
For the purposes of this analysis, “historic buildings” (as opposed to historic district buildings) are defined as structures constructed prior to 1960. This cut-off was selected to capture formally designated landmarks as well as the broader pre- and postwar building stock constructed before major zoning reforms and changes in construction typologies. Historic buildings may exhibit heightened vulnerability to flooding regardless of landmark status.
How did we gather building and property data?
All information presented is derived from publicly available sources. For property-specific details, please consult the Department of City Planning’s Zoning and Land Use Application (ZoLa), which provides access to zoning, building information (via BISWEB), and property records (via ACRIS). Building data was sourced from the Department of City Planning’s Primary Land Use Tax Lot Output (PLUTO) dataset and supplemented with Department of Buildings (DOB) Building Footprints records to determine construction year.
How did we identify landmarks and historic districts?
Individual landmarks and historic districts were identified using data published by the Landmarks Preservation Commission (LPC).
How did we project future flooding conditions?
Projected flooding conditions were derived from the Department of Environmental Protection (DEP)’s stormwater flood projections for future stormwater-related flooding in an extreme rainfall scenario. DEP’s extreme rainfall scenario, with a 1% chance of occurrence per year, was selected as the most conservative representation of future stormwater flood coverage.
How did we analyze neighborhood-level risk?
To reflect the primary role of future flood exposure in shaping vulnerability, the analysis was weighted with 50% allocated to projected flooding, 30% to the concentration of historic buildings, and 20% to the concentration of below-grade basements in small residential buildings. Available data on basements is limited to one- to three-family buildings. There is no distinction between inhabited and uninhabited basements.
How did we calculate the number of New Yorkers living in buildings that will face flooding by 2080?
To estimate the number of New Yorkers currently living in buildings that will face future flooding, the number of units per lot was multiplied by the average household size across each borough. For buildings that shared a lot but faced different flood risk, relative building footprint size and height were used to assign the estimated number of units per building. Only buildings with footprints that intersected the 2080 extreme rain scenario flood layer were counted.
If you have questions about how this information has been represented or analyzed, please contact us at planning@mas.org.
Additional Links
- MAS’s Greener Corridors initiative explores policy solutions to flooding and extreme heat along New York City’s busiest roads.
- Living Above the Street, a 2023 research study by Columbia University researcher Ziming Wang that examines historic resources in New York City’s 1% and 0.2% floodplains.
- MAS’s Stitch in Time initiative introduces nine historic building demolition case studies.
Footnotes
1. Analysis conducted by the Municipal Art Society using Department of Buildings (DOB) Footprints records and Landmarks Preservation Commission (LPC) data.
2. Carbon emissions savings from reuse vary by individual building. The initial construction contributes significantly to a building’s lifecycle emissions. See: National Trust for Historic Preservation.
Help us continue our planning advocacy on behalf of New York City.
DonateRelated Initiatives
Related News + Reports