The Climate Risks & Adaptation Explorer
A Mapping Collaboration with NYCHA
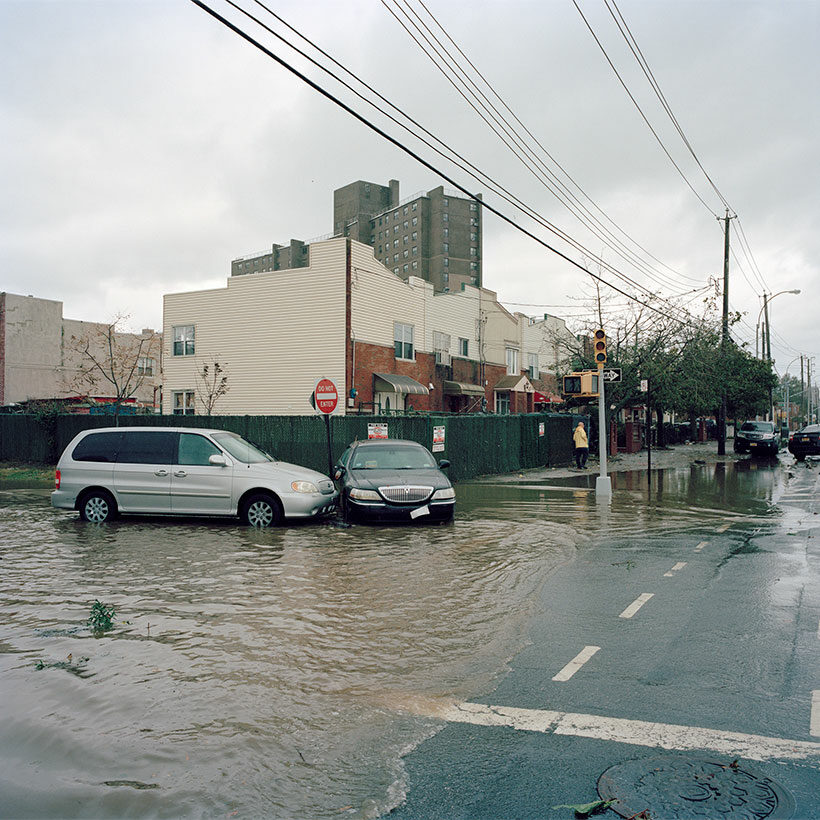
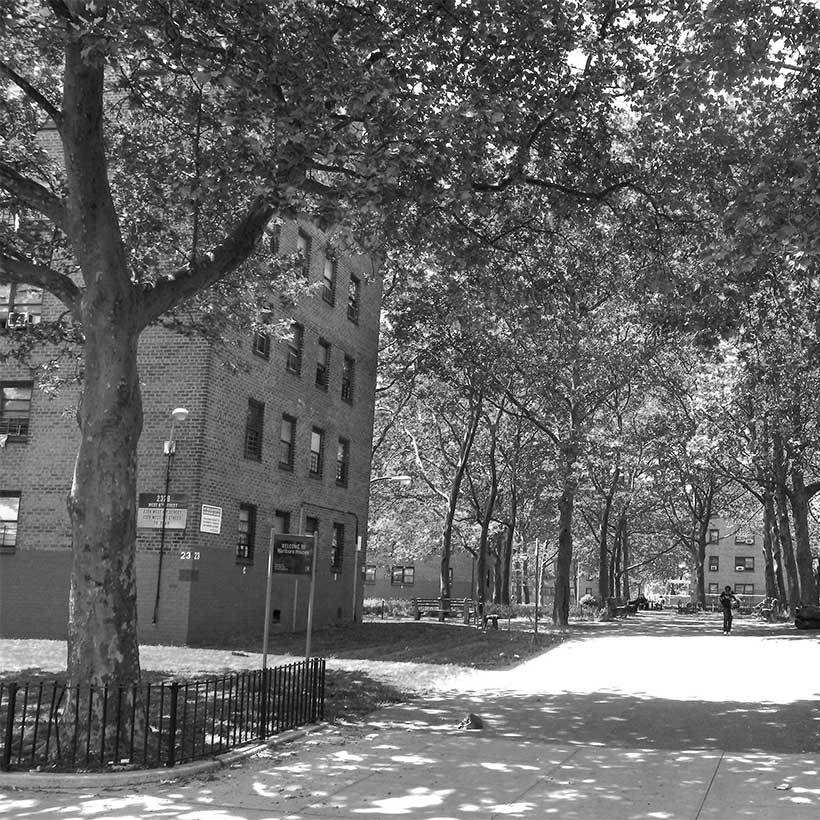
Like many cities around the world, New York City is contending with climate change on multiple fronts. Summers are hotter, rain is more frequent and intense, and sea level rise is increasing coastal flooding. In 2021, the New York City Housing Authority (NYCHA) released its Climate Adaptation Plan to address these issues. The Plan conveys the Authority’s understanding of how climate-induced hazards will affect NYCHA in the coming decades, points out where there are vulnerabilities to climate-induced hazards, and provides an approach to preparing NYCHA for a changing climate.
MAS worked with NYCHA to create an interactive web map that would visually communicate the threats posed to NYCHA by extreme heat and coastal and rainwater flooding, as well as the Authority’s climate resiliency investments. Intended for use by NYCHA residents, elected officials, and the broader public, the goal was to meaningfully convey the relationship between hazards and investments at multiple scales, from individual NYCHA campuses to neighborhoods, council districts, and the entire city. NYCHA and MAS also sought to provide a list of climate-related resources for users, such as the locations of cooling and hurricane evacuation centers.
NYCHA’s Climate Adaptation Plan evaluates coastal flooding, storm surge, and extreme heat metrics across over 300 NYCHA developments citywide, many of which are within the floodplain and coastal areas susceptible to storm surge. MAS worked closely with NYCHA to identify datasets and select the appropriate hierarchy of information, establishing the developments as the foundation upon which data would be layered and visualized. Design priorities for the interactive map included pop-up windows that display information on an individual development level and layers that could be toggled to show spatial relationships between developments and climate risk factors. We also wanted to include a list of key terms, an explanation of why certain risk factors were selected, and how and where those risks are being mitigated. The final design needed to balance this guiding text with the map’s functionality.
The final map (created using ArcGIS Experience Builder) is an example of the types of small-scale collaborations that are possible between the public and nonprofit sectors, one that will help users more deeply understand the scale of climate risks and completed and future investment needs at NYCHA, especially in areas where a confluence of hazards poses the greatest threat.
Project Team: Stephen Albonesi, Rawnak Zaman

Become a member to enjoy discounts to events and tours.
Learn about membershipRelated Initiatives

Supporting New Yorkers to become stronger advocates for their neighborhoods
Related News + Reports